
Introduction
A common example of an investment banking case study might involve creating a PowerPoint slide or deck. In this post, I walk through some tips that have helped me in the past when tackling such case studies. Considering this type of task is so closely related to what an intern actually does in the role, many of these tips and techniques were learned during my summer internship. The one-slide company profile advice is particularly relevant if you have an internship coming up regardless of whether you’re still in application season.
Advice for making a one-slide company profile
Use a quadrant structure
Using a quadrant structure may seem like you’re condensing too much information when PowerPoints should have less text and more diagrams, but this is commonly used in the industry because of how much information can be conveyed in a small space.
What should you include in those four quadrants? Although the list is endless in terms of what you can include, here is what I would aim for:
Quadrant 1 – Company overview
The company overview should be the quickest component since this is a simple search and extraction task but here are things you may want to look out for:
- Two-line summary of what the company does or split their different operations in the quadrant using numbers/bullet points
- Include when the company was founded, their HQ and number of employees (LinkedIn is a great place for this)
- Add a line about what you think differentiates them if the quadrant is still looking skinny
- The biggest hack is including a box with logos of their key partners, clients, or recent acquisitions – the more visual and engaging your slide is, the better, and logos are one of the most effective ways of doing this
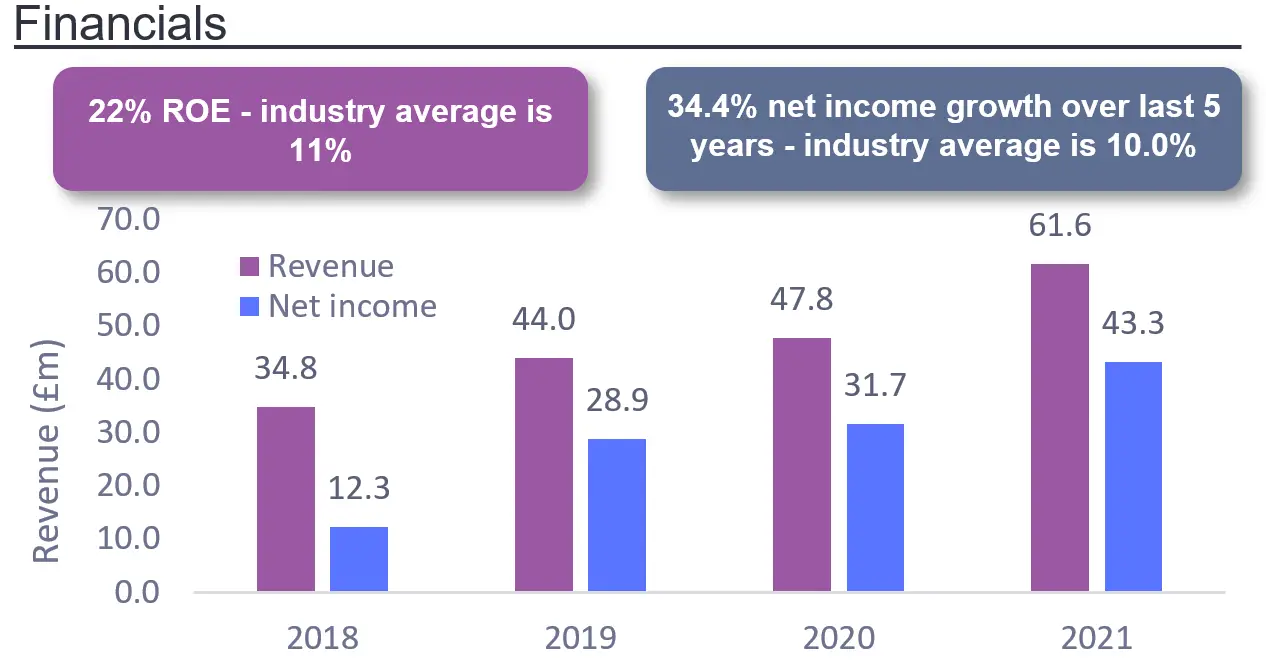
Quadrant 2 – Insight into financials of the company
A quick way of illustrating the company’s financials is creating a bar chart in Excel based on the revenue figures for the last three years and then pasting this into your PowerPoint slide.
I recommend clicking on and deleting the horizontal lines in the background and clicking on the plus icon in the top right of the bar chart as you hover over it, then ticking “Data Labels”. If you are including both revenue and net income figures, you would want to tick the “Legend” option as well.
Alternatively, an insight into the company’s financials might include a table summarising key financial data available online:
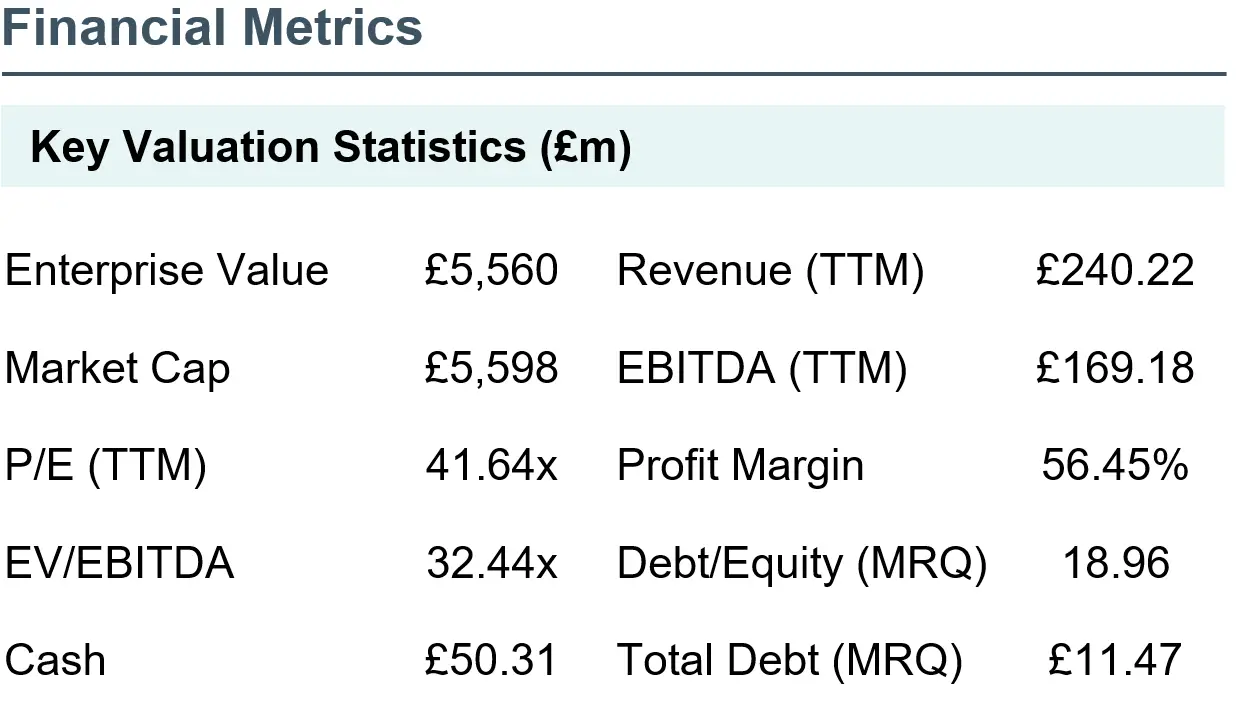
If the company isn’t public, check Companies House if they’re a UK company where you’ll be able to access their historical accounts. Another option for private companies is searching for key information about the number of merchants or number of registered users they have. You may be able to find key revenue information from press releases found through a Google search, but beware that such research tasks sometimes require tenacity considering the information might not be available on the internet.
Quadrant 3 – Key management
This is one of the easiest quadrants to nail since you just need to quickly locate three key leaders of the company e.g. the CEO, CFO and CTO or COO. Include a line in bold showing their name and role, then include a couple of bullet points below. The bullet points could be information on their ownership stake in the company and key contributions towards the company’s most recent development, or simply previous experience and qualifications.
In line with the philosophy of trying to make the slide as captivating as possible, I strongly advise including images of management. Here is how you can make the images consistent with each other:
- Paste the image found on Google into your slide
- Create a square (click objects, then the square and hold down shift as you enlarge the square to ensure its dimensions are not distorted) then crop the image using the square as a guide
- Click the image, go to picture format, click the crop dropdown menu and then crop to shape and click the circle – this should produce three consistent circular pictures…See the points below where I discuss PowerPoint shortcuts for alignment tricks
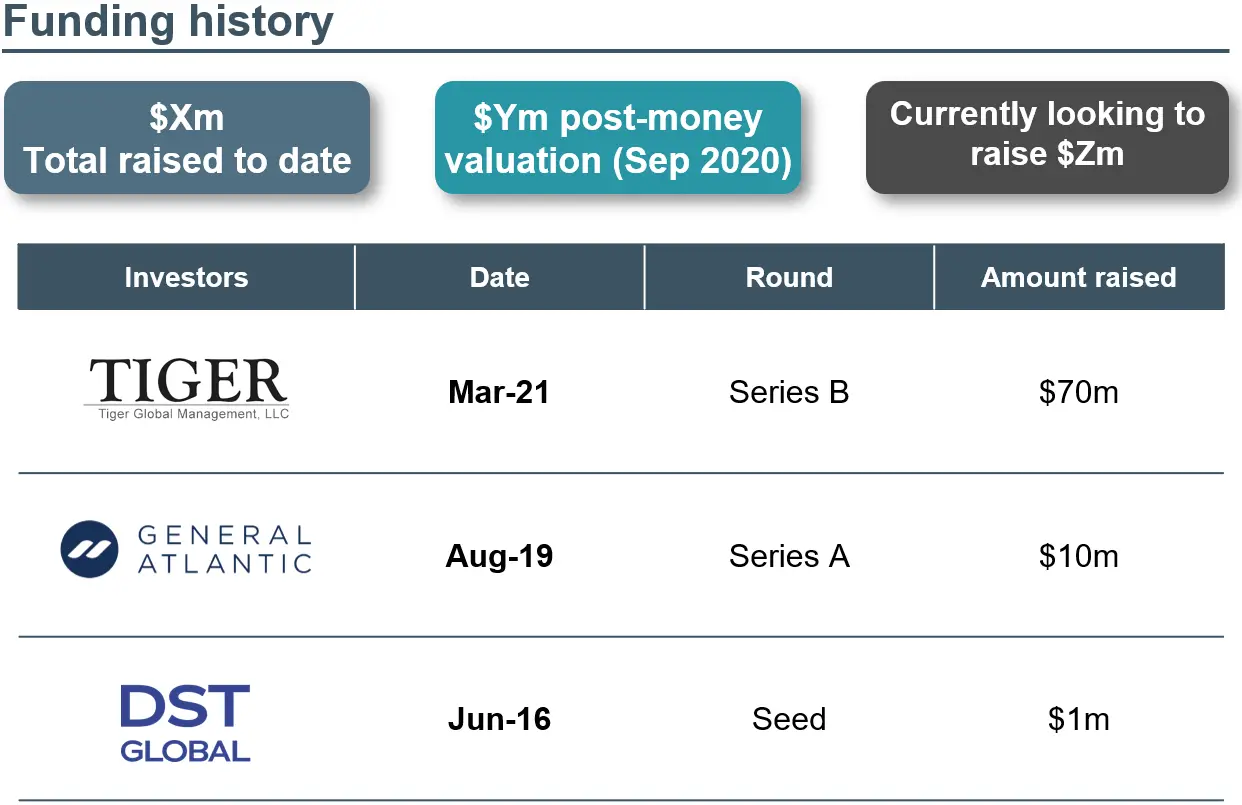
Quadrant 4 – Funding history or stock evolution
A quick way to finish off your slide is by pasting in an image of the stock performance over the last year and scrolling through the Yahoo Finance news feed to track reasons for potential changes that you can talk about in the interview where you present the case study. If you have more time, downloading the stock price data for the past year and creating a line graph of this would be even better.
If the company you’re looking at is not publicly traded, then you can create a table displaying the funding history including the investors, the date, the funding round and the amount raised plus some boxes detailing the total raised to date and valuation, which can be found on sites like Crunchbase and Pitchbook.
When pasting logos onto a slide, it is best to delete the white background or opt for the SVG version of the image sometimes available in Google Images. I use ‘remove.bg’ for a quick way of removing white backgrounds.
Use the QAT alignment shortcut
The alt alignment shortcut is something you cannot miss out on. Rather than sitting there trying to perfect the alignment and distribution of the images for the CEO, CFO and CTO, right-click the alignment tool found under the ‘Picture Format’ tab and add it to ‘Quick Access Toolbar’ before rearranging for the alignment key to come up as the first shortcut. Then click ‘alt’ followed by ‘1’ on your keyboard to access the alignment options – this is for Windows which most laptops at ACs will use unless you’re doing the AC virtually using a Mac.
You’ll see that when you click the alt key in PowerPoint, an array of letters appears on the toolbar, which indicates the keys you can click to access an option. The alignment and alt key shortcut are some of the most powerful tools Microsoft have added to PowerPoint, so be sure to take at least 15 minutes to get familiar with them.
Advice for making a deck e.g. an extended company pitch
The company profile advice should help in a variety of contexts beyond a one-slide profile since the quadrant structure can be used for summarising key rationale for a deal, key points to an investment thesis and more.
However, such a short exercise is limited to an on-the-spot case study vs a take-home case study exercise you would do in the days leading up to some assessment centres. So below I’ve included key points of advice for creating a more substantial presentation.
Do not overcomplicate – less is more
Spending hours upon hours preparing a PowerPoint deck with many components for a mere 10-minute presentation is the road to disaster. Limit your slides as much as possible e.g. 5 slides for a 10-minute presentation. If you overload the presentation, you’ll be tempted to talk too fast and rush your points. When you rush what you’re saying in front of an interviewer, you risk giving off the impression that you think you’re not worth their time.
Use a template for the DCF or company comparables if you need to include this
Use a template if you are expected to include valuation analysis to save time. Valuation analysis doesn’t have to be complicated if you are using a guide. However, beware that if you do decide to include this in your presentation, you will be grilled so it can sometimes be a shot in the foot.
A big mistake I made in one of my assessment centres was going too fast on the DCF appendix slides which I had left till the end (1) because I had included too much information in the other slides and (2) since I was less confident about the valuation technique and knew the interviewers had much more knowledge than me.
Make the slides as visual as possible
Using icons can enhance your slide for example on a summary page to illustrate the different points you’re making – see Noun Project or UXwing for examples of where you can access icons to paste into your slide.
The most appealing visual enhancer for any PowerPoint is including logos. E.g. logos of competitors, logos of companies acquired, or of investors – there is a vast list of opportunities in terms of potential options.
Where these tips might be useful
The most direct application of these tips is when you’re preparing for an AC and you expect there to be a research-focused case study task. Or perhaps you’ve been given a take-home case study task and need to prepare a PowerPoint presentation before the AC. Regardless of whether you end up getting such a task in the AC, the type of skills involved are very much aligned with the job itself which is why this is commonly used in interviews.
Outside of applications, such PowerPoint presenting skills can be applied in a variety of other scenarios for example if you’re pitching a stock for a society at your university, taking part in a society-related competition, or presenting consulting work you’ve done as part of another university society.